
The Economics behind Sisyphus
The economics of Sisyphus include costs and revenues, plus comparisons with other energy delivery systems.
Basic Costs
The six basic capital cost elements for a Sisyphus system are shown in the table below. The total capital costs for a system will depend on the size of the system, so the cost values are given in units appropriate for the element to allow for ease in computing total costs. For example, the cost of land is given in dollars per acre and the cost of the electrical systems are given in dollars per MW(e), the electrical throughput of the system. The cost for land depends on the site, not just on the system itself, so it has no listed value in the table. The values that are listed are estimated (as of 2015) and are based on expected values after more than one system has been built. The values for the first system will be higher.
| Cost Element | Value | Unit |
| Capital cost of land | $/acre | |
| Capital cost of guideway | 5,735 | $/meter |
| Capital cost of vehicle | 1,652,000 | $/vehicle |
| Capital cost of storage yard | 400,000 | $/acre |
| Capital cost of 100 mton block | 3,485 | $/block |
| Capital cost of electrical systems | 100,000 | $/MW(e) |
The total investments for two example systems are shown in the table below, using the values from the table above. These systems are based on an installation on the Buffalo Mountain site in East Tennessee where the elevation difference is 640 meters, with a 26% grade. The site lies in the Tennessee Valley Authority (TVA) right of way for a power line and so the land cost is zero. The first example is a 200 MWH system (storing 200 MWH of energy each night) and the second is a 1000 MWH system. The 1000 MWH system values are not in addition to the 200 MWH system values; rather, they include the values for the smaller system. Both examples exclude some of the testing costs described in the Future Plans page. The Depreciable Assets item is a memo item, used in the annual depreciation costs in a table below.
| Investment | 200 MWH | 1000 MWH | ||
| Cost Element | Size | Value | Size | Value |
| Capital investment in land | 15.9 | $ 0.0 M | 57.7 | $ 0.0 M |
| Capital investment in guideway | 6300 | $ 36.1 M | 8050 | $ 46.2 M |
| Capital investment in vehicles | 12 | $ 22.6 M | 40 | $ 68.9 M |
| Capital investment in storage yards | 2.4 | $ 2.6 M | 32.0 | $ 12.8 M |
| Capital investment in blocks | 1150 | $ 4.0 M | 5750 | $ 20.0 M |
| Capital investment in electrical systems | 25 | $ 2.5 M | 106 | $ 10.6 M |
| Capital investment, miscellaneous | $ 0.9 M | $ 8.4 M | ||
| Capital Investment Total | $ 68.7 M | $ 166.9 M | ||
| Labor Investment | $ 7.8 M | $ 15.0 M | ||
| Total | $ 76.5 M | $ 181.9 M | ||
| (Depreciable Assets) | $ 63.8 M | $ 138.5 M | ||
Operating and Financial Costs
The four basic annual operating and financial cost elements are also estimated, as shown in the table below. Depreciable assets are less than the total investment because depreciating simple concrete blocks over 30 years doesn't make sense. The $ 80/MWH (8 cents/KWH) price for purchased energy is based on the low off-peak pricing for power. It should be compared to the sale price of energy in the financial results section. These values will differ depending on the local power prices at the site of a Sisyphus system.
| Cost Element | Value | Unit |
| Operation & Maintenance (O&M) | 5% | of Investment |
| Energy purchased | $ 80 | $/MWH |
| Depreciation | 1/30 | of Depreciable assets |
| Interest payment | 3.5% | of Borrowings |
| Royalty payment | 1.0% | of Delivered energy |
The total annual costs for the two example systems are shown in the table below.
| Annual Costs | 200 MWH | 1000 MWH | ||||
| Cost Element | Basis | Value | $/MWH delivered |
Basis | Value | $/MWH delivered |
| Operation & Maintenance (O&M) | $ 68.7 M | $ 3.4 M | 52.0 | $ 166.9 M | $ 8.3 M | 25.3 |
| Energy purchased | 73,000 | $ 5.8 M | 88.4 | 365,000 | $ 29.2 M | 88.4 |
| Depreciation | $ 63.8 M | $ 2.1 M | 32.2 | $ 138.5 M | $ 4.6 M | 14.0 |
| Interest payment | $ 68.7 M | $ 2.4 M | 36.4 | $ 166.9 M | $ 5.8 M | 17.7 |
| Royalty payment | $ 13.2 M | $ 0.1 M | 2.0 | $ 66.1 M | $ 0.7 M | 2.0 |
| Total | $ 12.9 M | 196.4 | $ 48.5 M | 147.7 | ||
Financial Results
The income is entirely based on the sale of the recovered power that has been stored. Two factors drive the results: the peak load price of power and the efficiency of the system. The sales price of power for these examples is $ 200/MWH (20 cents/KWH). The efficiency of the Sisyphus system is about 90%, which means that 90% of the power that is purchased can be recovered and sold. Net revenue is gross revenue minus energy purchases and O&M costs. Profit is net revenue minus depreciation, interest payments, and income taxes. Return on Investment (ROI) is profit as a percent of total investment.
| Annual Results | 200 MWH | 1000 MWH | ||
| Element | Value | $/MWH delivered |
Value | $/MWH delivered |
| Gross Revenues | $ 13.2 M | 200 | $ 66.1 M | 200 |
| Net Revenue | $ 1.8 M | $ 23.9 M | ||
| Profit | -$ 0.7 M | -11 | $ 11.3 M | 34 |
| ROI | -1.1% | 6.8% | ||
Comparison of Power Source Costs
The true sources of electric power are power generation systems, such as fossil fuel (e.g., coal) fired steam plants, nuclear power plants, (natural) gas turbines, hydro-electric power plants, windmill farms, and solar panel plants. However, systems that provide power that would otherwise be lost can also be considered sources of power. Some losses are unavoidable, none of the true sources of power convert all of the input energy content (fuel, water pressure, solar input, etc.) 100% efficiently. Such losses can be reduced by replacing an inefficient source with a more efficient source; however, some loss remains. The losses addressed by Sisyphus and other energy storage systems are those caused by the missmatch in timing of supply and demand.
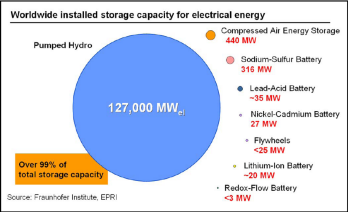
Currently, we are not able to store energy in meaningful quantities. The figure to the right shows the global stored energy capacity by storage type (described later). Pumped hydro accounts for more than 99% of this capacity. The total U.S. electrical generation is about 1100 GW and the U.S. pumped hydro capacity is about 40 GW. Thus the U.S. energy storage capacity is only about 3.6% of the total generation capacity.
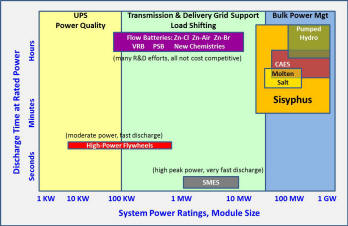
The next figure helps explain this division. This figure (modified from an EPRI figure) shows the total capacities of each energy storage type (given the economic sizes of the systems) versus their discharge times. Certain uses require positioning in different areas of the figure. Uninterruptible Power Sources (UPS) require very quick discharge times and (generally) smaller power ratings. Support for load shifting within the power grid requires medium power ratings and variable discharge times. Bulk power management (the primary subject of this project) requires large power ratings and medium to large discharge times. System cost per MW is also a factor, but these two figures do not address system cost. This will be addressed in the table below.
Pumped hydro relies on the simple physics of potential energy: moving a mass away from the center of the earth requires energy, which is stored as potential energy (minus efficiency losses). Returning the mass to a lower level enables the recovery of this energy and conversion to electrical energy (minus efficiency losses). In pumped hydro systems, water is pumped at very high pressure into a much higher storage reservoir. This requires a large and costly dam with huge pumps. When the energy is required, the water is allowed to flow down through a turbine generator to recover the energy. The efficiency of pumped hydro (recovered energy/input energy) is about 70%.
Compressed Air Energy Storage (CAES) also relies on simple physics: air is compressed into a chamber and then used to drive a generator to recover the energy. CAES has at least two major problems. The first is that compressing air also heats the compressed air. If this heat is lost prior to recovering the energy this results in an additional efficiency loss. The second problem is that for large scale uses, the air is compressed into a cavern, which is inherently dirty. The expanding air that drives the generator carries some of this dirt into the generating system. The efficiency of CAES systems is about 50-55%.
Molten salt systems (often used in solar energy collectors) use energy to melt salt. The molten salt heats water to drive a steam generator. The cooled salt is collected and used in the next cycle. The molten salt system obviously has inherent dangers due to the temperature involved. The major problem for uses other than with solar energy collectors is that the initial energy is not present in the form of heat, so that there is a conversion step from electricity to heat to melt the salt that is required. The efficiency of molten salt systems is about 70%.
Flywheels are simply very massive wheels. Energy is stored by spinning the flywheel to higher revolutions per minute and recovered by using the rotation to drive a generator (reducing the speed).
Superconducting Magnetic Energy Storage (SMES) stores energy as a direct current flow in a superconducting coil. As shown in the figure, SMES systems are capable of medium power ratings and have extremely short discharge times. They also have very high efficiency values, generally greater than 95%.
Batteries of various types are also used for energy storage. Only those that have potential for large scale use are shown in the figure above. Cost is a major factor for batteries since the power rating scales linearly with the required number of batteries. As the required number of batteries increases, the cost does also.
Sisyphus addresses all of the foregoing issues and provides superior solutions for the needs of national and worldwide efficient energy management. This is represented in the figure, showing how Sisyphus systems cover the ideal area for bulk power management.
The table below compares the costs of electrical energy (in $/MWH) among several options. The numbers in the table must be regarded as approximate for several reasons. First, actual power plants are based at a particular location, have a particular design, and are built at a particular time. Therefore, their actual costs are unique. The numbers in the table are "average" numbers, where the proper weightings to produce the averages are debatable. Second, the numbers are derived from several sources and may contain hidden assumptions that differ among the sources. Third, each type of power source has its own constraints, making comparisons difficult. For example, hydro-electric plants must be built on rivers with particular characteristics and all or almost all of those situations may have already been used. Fourth, some numbers are estimates, with unknown accuracy values. This is particularly true of the Sisyphus numbers and the O&M costs for pumped hydro storage. Nevertheless, the table gives a clear overview of the situation, as long as there is unused energy available for storage, building and using a Sisyphus system is less expensive than building a new power generating system of any type, except perhaps hydro-electric. It is also less expensive as a replacement power source (comparing operating expenses) than any source other than hydro-electric.
| Type | O&M | Fuel | Subtotal | Capital Cost/ Delivered MWH |
30 yr Ammor- tization |
Total | Other Estimate |
| Fossil Steam | 8.86 | 28.34 | 37.20 | 1441.90 | 48.06 | 85.26 | 121.50 |
| Gas Turbine | 5.22 | 30.45 | 35.67 | 304.27 | 10.14 | 45.81 | 85.05 |
| Hydro-electric | 11.34 | 0.00 | 11.34 | 364.30 | 12.14 | 23.48 | 84.50 |
| Nuclear | 19.81 | 7.61 | 27.42 | 1933.16 | 64.44 | 91.86 | 96.10 |
| Pumped Hydro Storage | 43.12 | 0.00 | 43.12 | 862.36 | 28.75 | 71.87 | |
| Sisyphus (1000 MWH) | 25.27 | 0.00 | 25.27 | 505.31 | 13.97 | 39.24 |
The sources for the O&M, Fuel, and Capital Costs are from US Energy Information Administration (EIA) 2012 reports, with the Capital Cost/Delivered MWH calculated using EIA efficiency values. The Pumped Hydro Storage O&M costs, however, are calculated as 5% of the total Capital Costs for the system, using the same percentage as is used for the Sisyphus estimate. The Sisyphus numbers come from the estimates shown above. The Other Estimate values come from a Wikipedia article on levelized costs in 2012 dollars of electricity by source [http://en.wikipedia.org/wiki/Cost_of_electricity_by_source]. The differences in these estimates for Fossil Steam, Hydro-electric, and Nuclear lie in the estimates of capital costs, while the difference for Gas Turbine come from both capital costs and O&M plus Fuel costs. It should be noted that both Hydro-electric and Pumped Hydro Storage have severe location constraints and that both Pumped Hydro Storage and Sisyphus assume that there is excess power to be stored, as neither actually generate new power.
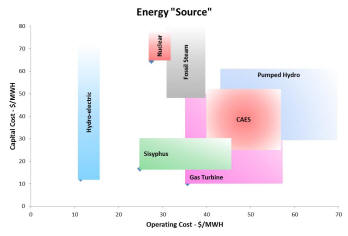
The figure to the right collects the capital costs and operating costs per MWH delivered from the table above. The "Other Estimate" data and other information is used to obtain estimates of the possible variations of each cost number and produce the cost boxes for each system. A cost box for CAES is also introduced to fill out the reasonable energy storage options.